
C++ Fast-track for Games Programming Part 7: Debugging
This episode covers debugging. We will see how an application can be halted at any time or at a specific line and how we can inspect variables to verify that everything works as intended. Debugging can be a complex process but we’ll limit ourselves to the basics of breakpoints and following program flow, while keeping an eye on variables.
Previous Part: FloatsNext Part: Addresses
Getting the Stuff You Need
For this tutorial, you will be using the same template from the 2nd tutorial:
 TheTemplate.zip
As usual, we will start with a fresh copy of the template. Extract the package to a new directory (say, C:\Projects\debugging – or wherever you saved your projects from the previous tutorials) and load up the .sln file. Remove the hello world code in the Game::Tick function.
Your Game::Tick function should look like this now:
|
27 28 29 30 |
void Game::Tick(float deltaTime) { } |
Debug Mode
Visual Studio projects typically can run in two configurations: Debug
and Release. You can select this mode in the Solution Configuration drop-down box in the toolbar.
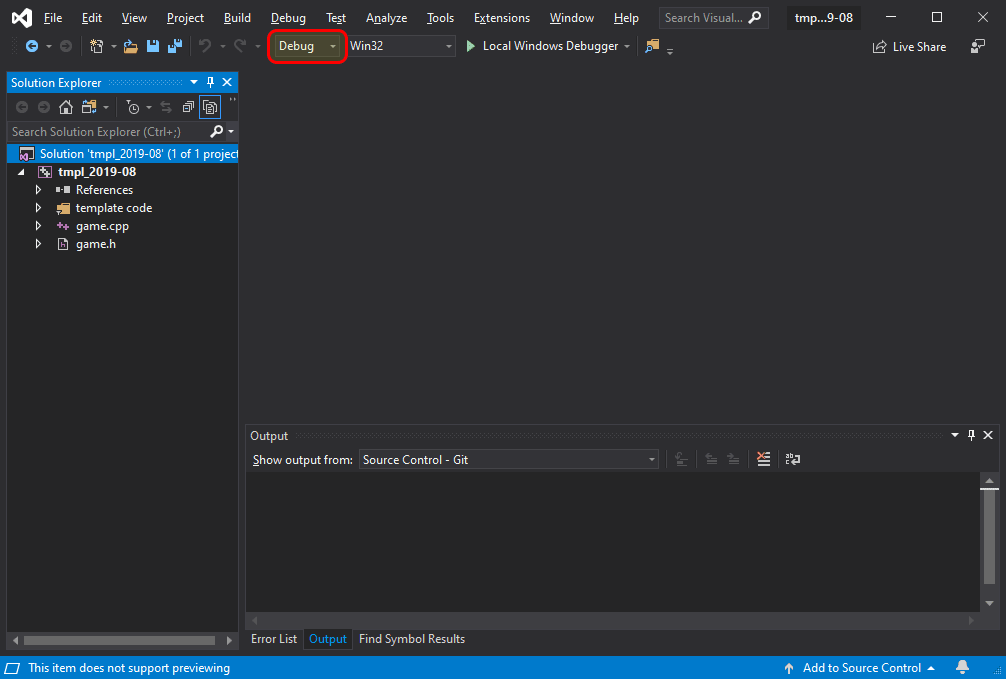
Debug Configuration
By default, Debug mode is selected.
So What’s the Difference?
Well, Debug builds generate larger, slower programs. To verify this: build your program – Select Build > Build Solution from the main menu (or use the Ctrl+Shift+B or F7 keyboard shortcut depending on your configuration). Go to the folder where you unpacked the template and you will see a new executable there (tmpl_2019-08_x86_debug.exe) is 45 KB.
You can run the executable directly from the output folder due to it knowing what .dll files it needs under what subfolder (under the folder dlls_x86 for 32-bit builds, or under dlls_x64 for 64-bit builds). We set this up for you to make it easy to run it, but normally you would need to make sure the right .dll files are in the same folder as your executable – or at least on the search PATH. Also keep in mind that DLL’s are built for specific platforms (e.g. 32-bit or 64-bit) – so don’t get them mixed up or you will get some interesting errors.
Now do the same in Release mode (change the compile configuration from Debug to Release). Interestingly enough, the template also puts the .exe right next to the .sln but with a slightly different name tmpl_2019-08_x86.exe – Yes, we set this up in the project settings for each configuration. 🙂 As you can see, the release .exe is slightly smaller at 43 KB.
Why is it Smaller?
The answer is: debug information. The Debug executable contains extra information, lacks certain optimizations, and adds a number of checks (e.g., array boundary checks). It will also initialize variables to 0. The Release executable on the other hand lacks the checks and variable initializations. As a result, it runs faster and is smaller.

Insert the following code in game.cpp:
|
24 25 26 27 28 29 30 31 32 33 34 35 36 37 38 39 40 41 42 43 44 45 46 47 |
Surface image("assets/ball.png"); // ----------------------------------------------------------- // Main application tick function // ----------------------------------------------------------- void Game::Tick(float deltaTime) { // clear the graphics window screen->Clear(0); // draw a grid for (int x = 15; x < 800; x += 16) { for (int y = 6; y < 512; y += 12) { Pixel p = image.GetBuffer()[x / 16 + (y / 12) * 50]; int red = p & 0xff0000; int green = p & 0x00ff00; int blue = p & 0x0000ff; screen->Bar(x, y, x + 12, y + 2, red); screen->Bar(x, y + 4, x + 12, y + 6, green); screen->Bar(x, y + 8, x + 12, y + 10, blue); } } } |
What it is supposed to do is a surprise, but for now one thing is clear: it doesn’t do it:
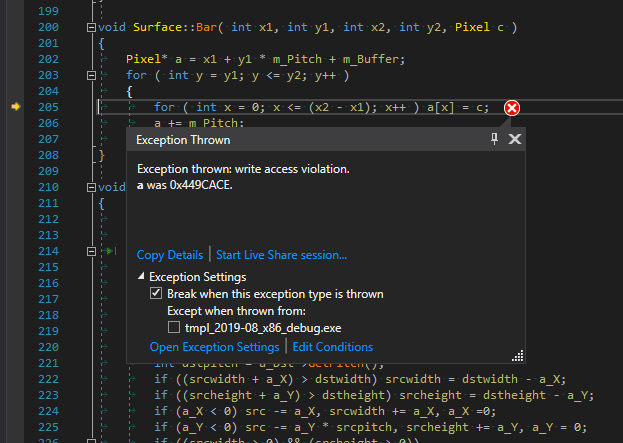
When running the Debug build, an exception is thrown. Now what should we do?
After you stop execution of the programme (or use the Shift+F5 keyboard shortcut) you will be looking at some template code: The Surface::Bar function, with a little yellow arrow pointing at a line that apparently caused a problem. Time to figure out what the problem is.
Gathering Intel
Let’s make sure we have the necessary windows open in order to start debugging the application:
- Select Debug > Windows > Call Stack from the main menu.
- Drag the Call Stack window to the right of the screen.
- Likewise, select Debug > Windows > Watch > Watch 1 from the main menu.
- Drag the Watch 1 window right of the screen as well, so the Call Stack and Watch 1 both both take up half of the vertical space.
You now have a layout as in the screenshot.
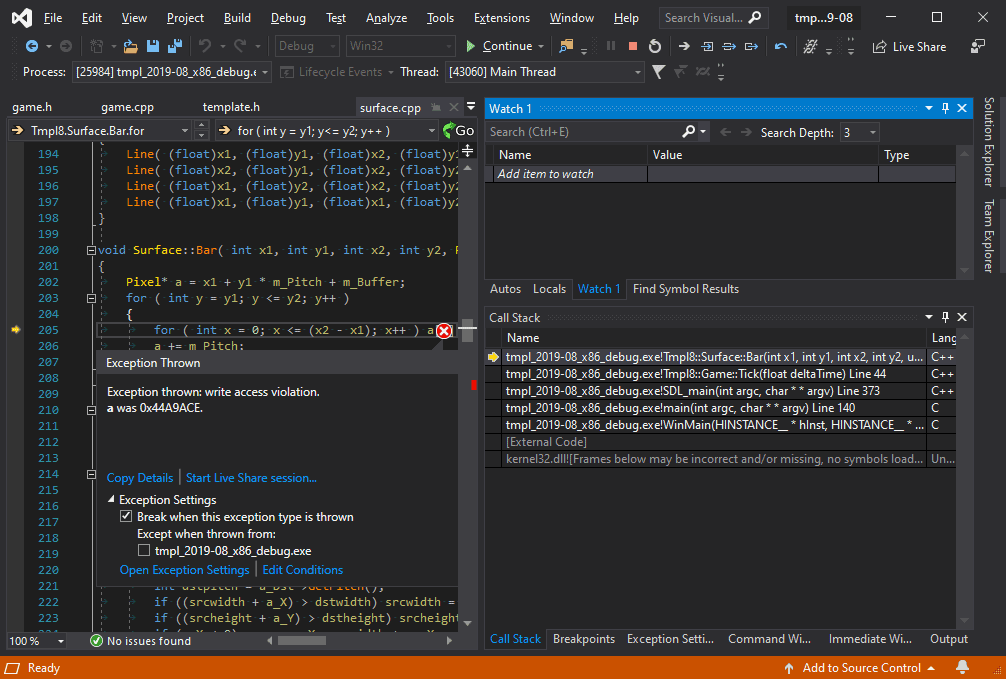
With this setup, you are able to see the values of variables and you can see the call stack which shows you how you got here.
The call stack is our first useful bit of information. It tells us where we are (a bit verbose: tmpl_2019-08_x64_debug.exe!Tmpl8::Surface::Bar) and how we got there (via Game::Tick). Double-click on Game::Tick method in the Call Stack window to see which line of code jumped to the Surface::Bar method.
Let’s go back to Surface::Bar method to see what’s going on. In the Watch 1 window, click on Add item to watch type (under Name) and type x1. You will immediately see the value of parameter x1, which was passed to Surface::Bar from the Tick function. Add y1 as well. It’s value is 514… And that’s outside of the screen (which is 800x512 pixels). Is that a problem? Yes it is: a chunk of memory was reserved for those pixels, and we’re trying to write outside of that chunk of memory. It’s illegal to access memory outside of the range of the allocated memory for the pixel buffer and the program crashes.
Fixing this is easy: in the Game::Tick method, make sure we don’t loop all the way to 512 in the y axis. Let’s loop to 480 or so instead.
|
33 34 35 36 37 |
// draw a grid for (int x = 15; x < 800; x += 16) { for (int y = 6; y < 480; y += 12) { |
Tracing
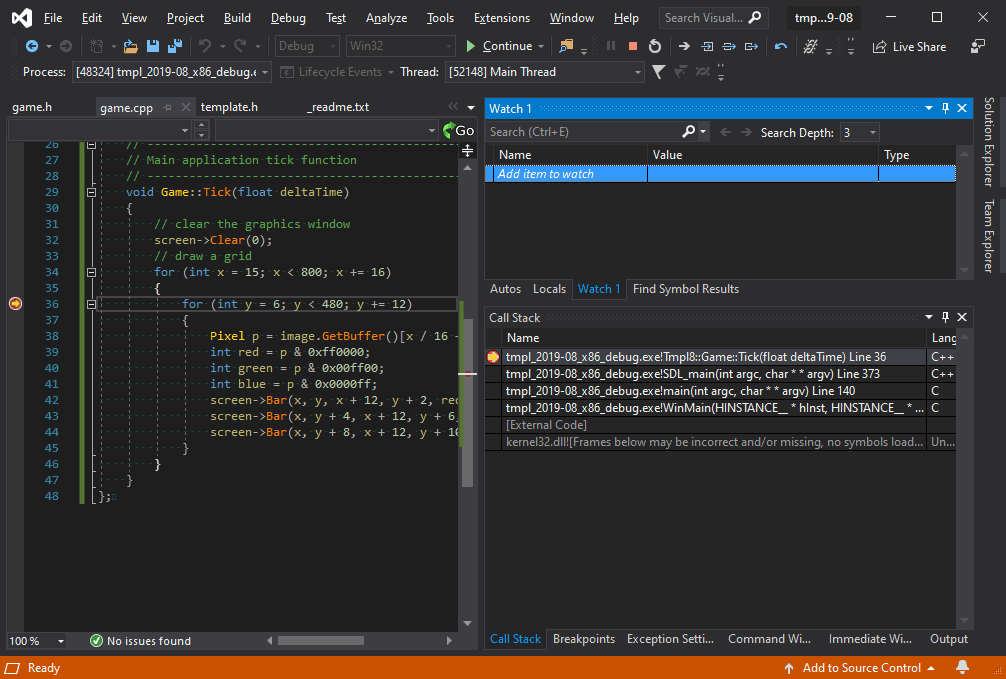
Obviously you don’t have to wait for a crash to freeze your program mid-flight. Move your cursor to line 36 in game.cpp and hit F9. The result is a red circle in front of the line. Now run the program again. It will halt at the line you marked. This is called a breakpoint, and you can have as many breakpoints in your program as you like.
Using breakpoints in your source code allow you to halt execution of the program.
Once your program is halted, you can continue execution using F5, or step through it one line at a time by pressing F10. When you encounter a function call (such as screen->Bar(...)), you can either step over it using F10, or into it, using F11 or step-out of the current function using Shift+F11. And, if you don’t feel like remembering those function keys: there’s icons on the icon bar for the same functionality.
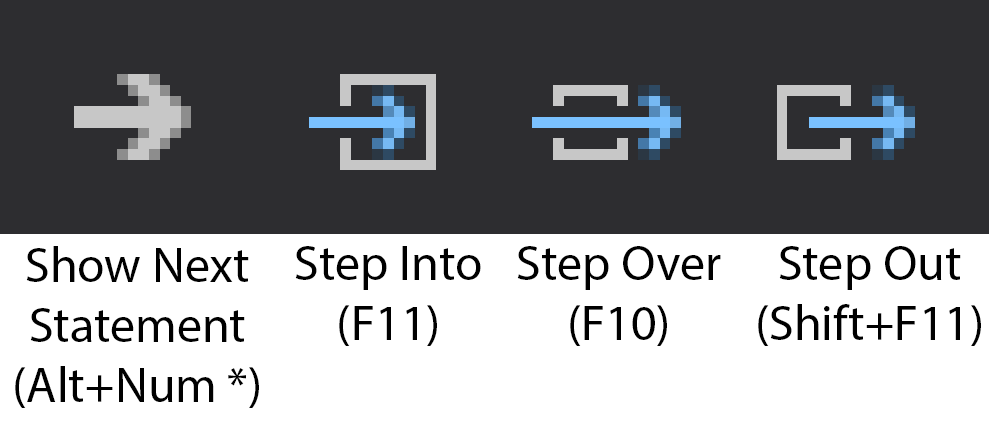
Use the debug controls to Step Into (F11), Step Over (F10) or Step Out (Shift+F11) of functions during debugging.
Conditional Breakpoints
Imagine you want to halt the program only when a certain condition is met, e.g. when the x coordinate exceeds 500.
One way to do this is by setting a condition for the breakpoint.
Select Debug > Windows > Breakpoints from the main menu.
Right-click on the breakpoint in the Breakpoints window and select Settings… item from the popup that appears.
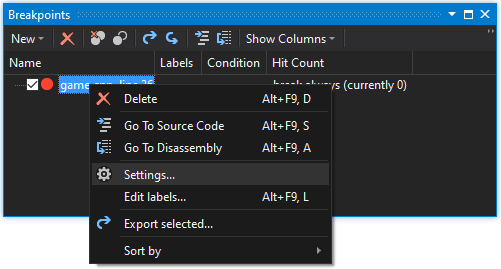
Right-click on a breakpoint in the Breakpoint window and select settings…
In the Breakpoint Settings window that appears, select the Conditions checkbox and type x > 500 in the text field.
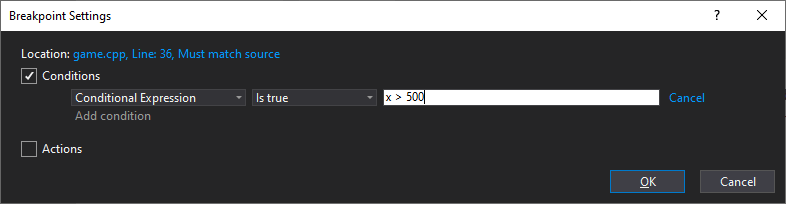
Add a breakpoint condition to only halt execution if x > 500 evaluates to true.
Or, keep it simple, and add the condition directly to your code:
|
36 37 38 39 |
if (x > 500) { int w = 0; } |
The int w = 0 statement is obviously irrelevant: it is just there to be able to place a breakpoint inside the if-statement.
w is never used, so it doesn’t actually produce code in your .exe for it. That means in turn that there is no code inside the if-scope, so that is removed as well. In debug mode, when these optimizations are disabled, this code will remain in the executable, but when running in Debug mode, you should not be concerned with performance. Trust No One
Some things are not supposed to happen. Perhaps you assume no one will draw boxes outside the screen. And still it happens. A great way to catch problems like that is using asserts.
Add the following line inside the inner for-loop:
|
38 39 40 41 42 43 44 45 |
Pixel p = image.GetBuffer()[x / 16 + (y / 12) * 50]; int red = p & 0xff0000; int green = p & 0x00ff00; int blue = p & 0x0000ff; assert(y < 400); screen->Bar(x, y, x + 12, y + 2, red); screen->Bar(x, y + 4, x + 12, y + 6, green); screen->Bar(x, y + 8, x + 12, y + 10, blue); |
Note that you cannot compile and you see assert has a red squiggly underlined. This is because we have not included the header file that the assert function comes from. If you are not sure, you can search to find out or just add the following at the top of game.cpp:
|
1 2 3 4 |
#include "game.h" #include "surface.h" #include <cstdio> //printf #include <cassert> |
Obviously this assertion is going to fail. When it does, the program will halt with the following message:
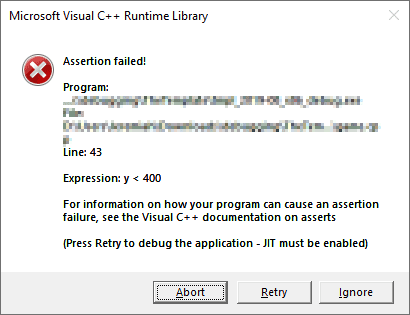
When an assertion fails, the Assertion failed dialog box is shown. Press the Retry button to debug the application.
It is a good habit to add assertions like these (well, slightly more sane assertions perhaps) to your program: they are only included in debug mode, and they add a fair bit of safety for those unforeseen situations.
Assignment
Debugging is something you need to get used to; once you are familiar with the process you will not be able to live without it. It’s a bit hard to give you a debugging assignment, so instead:
- Fix the
Surface::Barfunction so that it doesn’t crash when off-screen coordinates are specified. - Replace the
ball.pngimage with an image you found on the internet (i.e. not an image that is already in the assets folder). - Modify the size of the leds so that the full image fits on the screen.
so i fixed the surface bar function, no crash. but when i put in my own picture and modify the leds size, I either get a full HD picture in red. or a well colored picture where you can see the color lines running through and i dont know how to fix it
Ruben,
Please consider joining the Discord server (3dgep.com Discord).